In winemaking, having clear insights is critical whether it’s the middle of a busy harvest or for making strategic decisions year-round. Beyond the winemaking team, owners, financial professionals, and sales staff also depend on production data to track goals and navigate the business toward success.
However, the path to gaining these insights often involves exporting and manipulating data in spreadsheets. It’s a process that can be as time-consuming as it is frustrating, especially when the data isn’t readily accessible.
That’s why we’ve made some BIG changes to InnoVint’s reporting capabilities:
- InnoVint Custom Reporting: Create the exact reports you need, quickly. It’s interactive, it’s flexible, and it allows you to explore all of your bulk wine data in unlimited ways.
- New Report Explorer Interface: Designed for quick navigation so you spend less time searching for the reports you need.
Introducing: InnoVint Custom Reporting
InnoVint’s Custom Reporting functionality allows you to create dynamic, interactive views of your data across all wineries, wine lots, and associated data right inside of InnoVint.
We designed Custom Reporting to empower users with a personalized and immersive data analysis experience. Unlike conventional static reports, this dynamic document invites users to actively engage with the data, unlocking a new level of insight and decision-making. Easily highlight only the most important information so you can cut through the noise and focus on what really matters – making and selling great wine.
The Wine Industry’s Most Interactive, Dynamic Reporting Tool
While we are referring to these as reports, they are so much more than that. So, what makes InnoVint Custom Reporting so great?
- Complete customization: Almost every aspect of your reports is customizable. Effortlessly search, sort, and filter to create a view that meets your specific needs. And once you’ve got that perfect report, save it! When you come back, everything, down to the width of each column, will be exactly as you left it.
- Enhanced flexibility: InnoVint’s Custom Reporting takes the flexibility of spreadsheets and supercharges it with the power of InnoVint. Rearrange and pin columns to suit your analysis needs, and leverage our advanced grouping features to categorize wines in ways that make the most sense to you.
- Unmatched reporting power: Thanks to our powerful new database technology underneath, experience lightning-fast reporting no matter the volume of data processed. No waiting for data to load.
- Crowdsourced functionality: Your input drives our product, and we actively incorporate user feedback to enhance the custom report builder. Need a specific data point? Just let us know!
Custom Reporting in Action: Real-World Examples
With all of your wineries, active wine lots, and their associated data in one place, you’ll be able to get insights in record time! With Custom Reporting, there are unlimited ways to view and explore your data… Let’s look at a few real-world examples that can be used throughout your winery to make faster, more data-driven decisions.
Easy QA checks for production and aging processes.
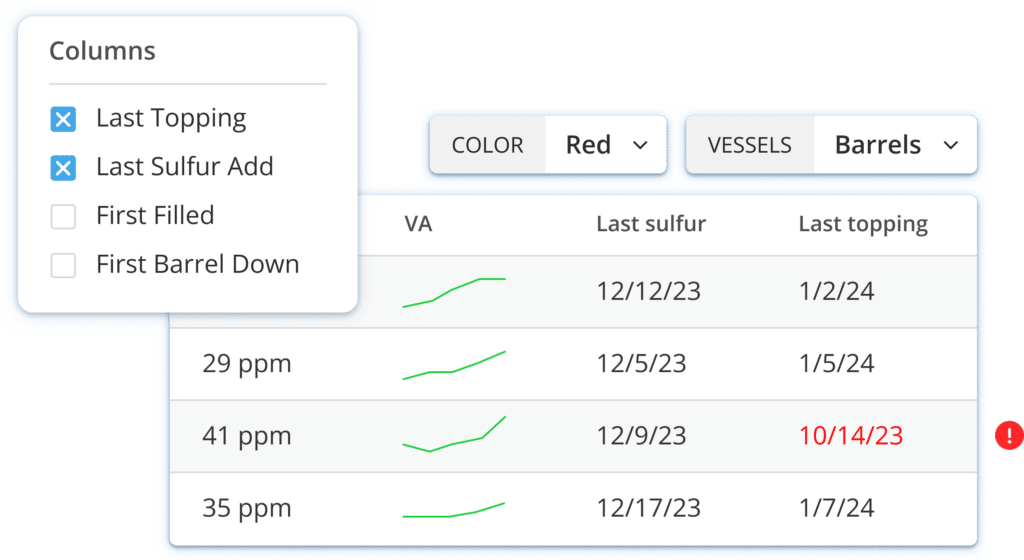
Your winemaking and production teams need to consistently monitor wines at every stage. Having a quick view of the current status of each wine lot – for example, when the last topping happened, or if analysis is out of range – makes it much easier to assess wine health and manage routine maintenance.
For example:
- See all red lots in barrel including the last topping date, the last sulfur date, with recent FSO2 & VA results (and trendlines!)
- See all lots with a VA over 0.5 g/L
- See lots in barrel with a last topping date greater than 2 weeks ago
- See lots still in weight, with a brix less than 0
- Check your final varietal percentages and bottling alcohols on pre-bottling blends
Track current costs, your way.
Finance professionals and winery owners can quickly group and visualize cost data in new ways, including by vintage, vessel, lot stage or wine program. The ability to easily audit cost allocations with more granular report options means more accurate data to make informed business decisions.

For example:
- See the current cost for each of my lots
- See lots in barrel with the current barrel depreciation cost
- See current costs for lots in tank with a stage of aging
- See all aging Cabernet Sauvignon lots, organized by cost
Manage all of your brands and locations in a single interface.
Having access to a consolidated view of all of your brands and locations – including in-process wine and COGS – is important. But having a dynamic view, with the ability to filter down to any subset of your data with one click, is invaluable. As brand portfolios inevitably change and locations are added or removed, InnoVint makes managing and maintaining a consolidated view easy.
For example:
- See all my lots across all my brands
- See only Green Acres Winery’s lots
- See the total cost of wine for each of my brands
- See all reds across all locations and brands
The sky is the limit to how you can utilize Custom Reports in your day-to-day operations. For InnoVint users, check out the Support Center to learn more ways you can customize your reports.
A More Modern User Experience
In addition to our new Custom Reporting capabilities, we’ve redesigned the Report Explorer interface. Our goal? Make it easier to access the reports you need.
- Search across all reports by name and description
- Add your most used reports to our new ‘Favorites’ section
- Access standard and Custom Reports on one page
Better Data = Better Decisions
At InnoVint, we believe access to better data is key to making better decisions across your winery and improving efficiency. We are excited to deliver these improvements to our users and continue to invest in making data-driven decisions a reality for all wineries.
If you’re interested in learning more about InnoVint’s reporting and analytics capabilities – or want an overview of the platform – let us know!